
CEA Plugins - Part 5: How to add your own plots to the CEA
This article goes into the details of the plots.yml file used in CEA plugins.
This is part 5 in a series of articles on CEA plugins:
-
Part 5: How to add your own plots to the CEA (this article)
plots.yml
The plots.yml file describes a list of plots to add to the CEA Dashboard. As with the scripts.yml file, the plots are listed by category. In the template, the category is named “Demand Summary”, the same as the category name used for the tools - It’s a good idea to keep these two names in sync.
Demand Summary:
  - label: Total System Demand
    data:
      location: demand_summary
      index: Name
      fields:
        - QC_sys_MWhyr
        - QH_sys_MWhyr
    layout:
      kind: bar
      title: Total System Demand
      yTitle: "Energy Demand [MWh/yr]"
      xTitle: Building Name
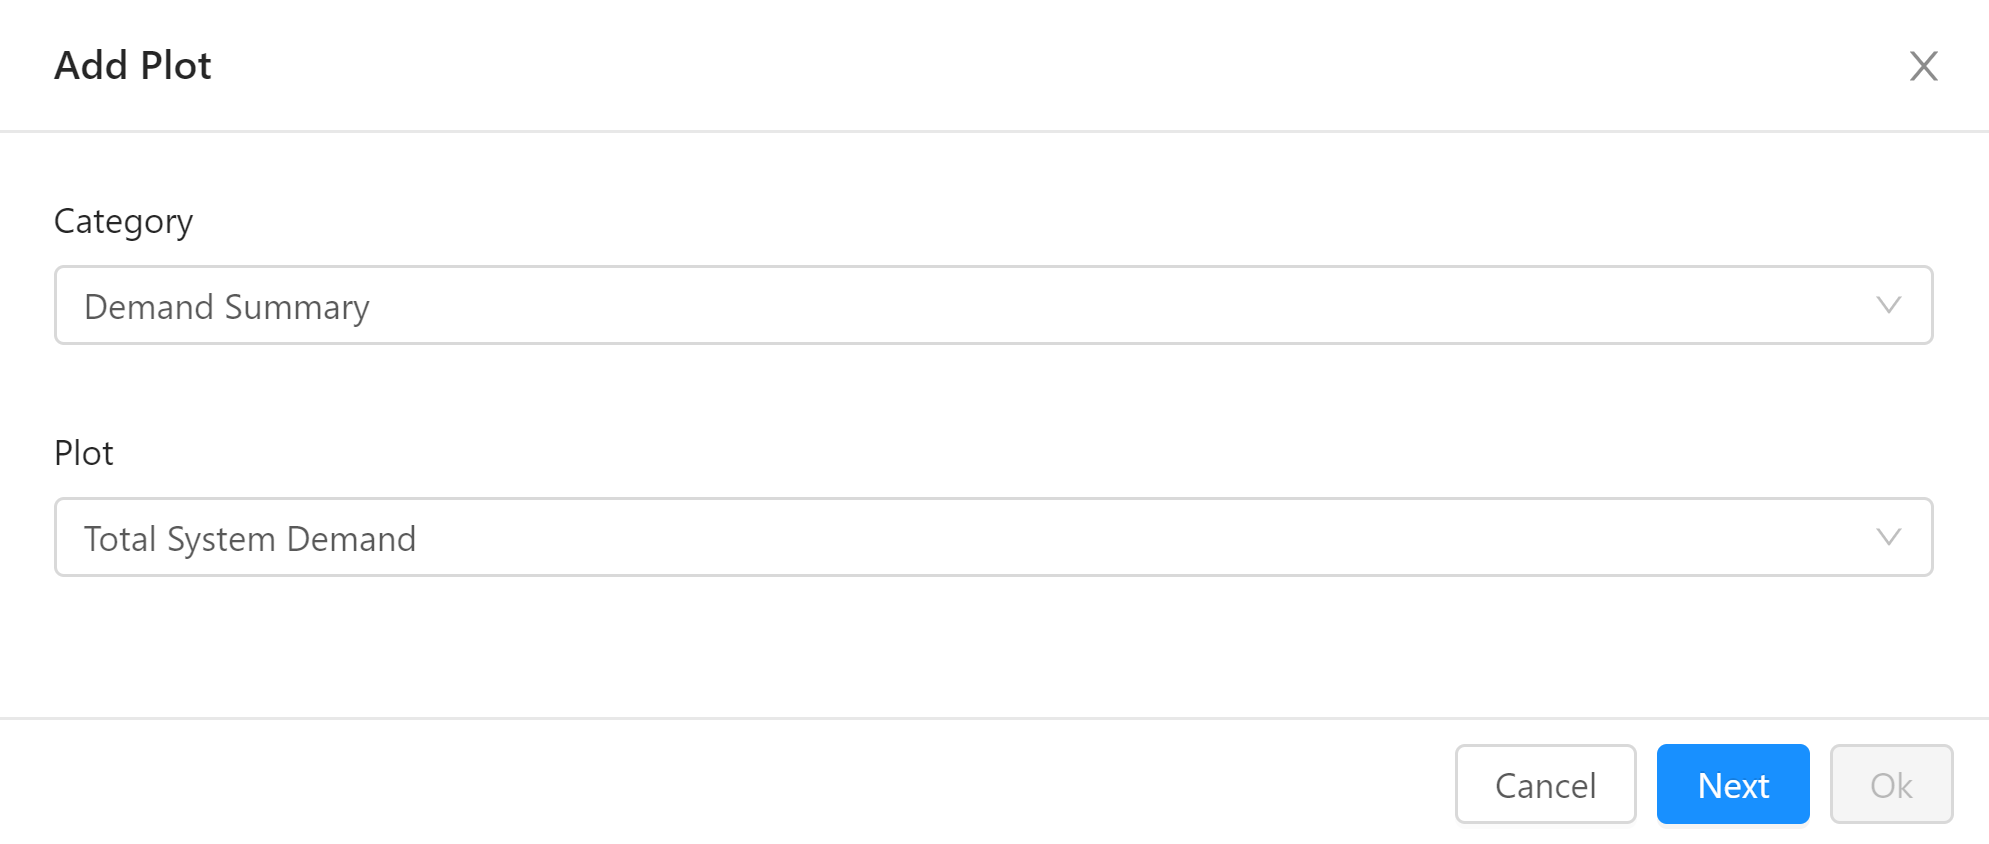
Each plot has a label: This is the name of the plot to display in the GUI when you add a plot / change a plot type:
The rest of the plot is divided into a data asection and a layout section.
The data part of a plot definition specifies:
-
location: the locator method to use for retrieving the data to plot - in the case of the template,demand_summarywhich is defined inschemas.yml.- NOTE: the fields
descriptionandplot-colorin the description of the data columns inschemas.ymlare used to define the text in the legend and the color of each series respectively.
- NOTE: the fields
-
index: the field to use as the index - if missing, no index is set on the data -
fields: a list of field names to use - if missing, all the fields in the data are used
The layout part specifies how the plot is to be shown. The contents are passed off to the iplot method from the cufflinks library. Check the documentation on the iplot method for more information on valid parameters.
The class cea.plugin.PluginPlotBase simplifies plot creation a lot compared to how the CEA core creates plots. This comes at the expense of flexibility. If you need more fine-grained controll over your plots, you can override the plots property in your plugin (check cea.plugin.CeaPlugin for the original definition) to return your own plot classes (possibly derived from cea.plots.base.PlotBase) - See CEA Plots - the Gory Details for more information on how to do that.